

Blog
Calculating Research Software ROI
- Higher Education
Cayuse recently hosted Quinnipiac University’s Grants and Contracts Specialist Carrie DePetris Duell for a webinar discussion on her efforts to calculate the potential ROI of implementing new research administration software (the full recording of which is available to watch for free here).
Now, we’re sharing the calculator spreadsheet template Carrie built to help other teams estimate the impact of adding new administrative research software at their own institutions.
Read on for a full breakdown of considerations for estimating software ROI, instructions for using Carrie’s template to build your own calculator, and a downloadable version of the template itself.
Initial considerations
Before we get to the calculator template, there are several factors to consider that will help gauge the efficiency of your existing processes and workflows and inform your later ROI estimates.
As Carrie discussed in the webinar, any effort to improve your research management processes begins with developing a thorough understanding of the existing processes, their shortcomings, and potential opportunities for improvement. This undertaking can be broken down into four steps that will make your later ROI calculations easier to estimate:
Step 1: Inventory current processes
Familiarizing yourself with your organization’s research management workflows and processes is always a helpful practice. Even if you are not directly involved in a particular process, it is worth understanding how your department operates, if only just to enhance your knowledge of how your work fits into the larger picture.
Take stock of the tasks different roles are responsible for and their practices for handling this work. How are requests sent? How are requests received? What systems do teams use for organizing information? Are the systems manual or digital? How is data stored and updated?
While not all-encompassing, the above questions can help guide your assessment and flag obvious areas for improvement.
Step 2: Compare with best practices, NCURA Standards
NCURA—the National Council of Research Administrators—is one of the leading organizations for advancing the profession of research administration and documenting research administration best practices.
Among their many beneficial services, NCURA provides helpful guides that establish baseline standards for research activities on four different levels:
- Unit-Level Sponsored Programs: Unit-level standards apply to individual units within larger research organizations.
- Central Sponsored Programs: Central standards apply to the practices of an organization as a whole.
- Research Compliance: Research compliance standards apply to the broad operational and core functional areas of research compliance programs (non-financial).
- Global Sponsored Programs: Global standards apply to any non-US institution’s research offices that follow the US model of higher education.
Submit a request to NCURA via the links above to receive a copy of any relevant standards, then review the standards and compare NCURA’s recommendations with your organization’s current practices. You may be surprised to find that some of your processes don’t align with the suggested standards, highlighting high-priority areas for targeted improvement.
You may also find it valuable to review the practices of comparable institutions to understand how peers structure their sponsored programs operations. Resources like Cayuse’s Connect Community, which includes example SOPs and workflow documents from customers, can provide helpful real-world benchmarks.
Step 3: Compare against other parts of your organization
With the NCURA standards and your current practices in mind, you can now take a closer look at processes and workflows used in other parts of your organization. While this step may not be necessary for smaller institutions, the processes in departments at larger institutions often vary more than you expect.
Reach out to research administrators and general administrators in other departments to learn more about the different roles and workflows involved in their jobs. You will likely find differences ranging from subtle to significant, including areas where one department’s existing processes align more closely with the NCURA standards than those of the other, as well as novel solutions to pain points that one department experiences but the other has resolved.
Be sure to stay in communication with your contacts in other departments; they can be valuable allies when making the argument for new processes and new research administration software to leadership teams, showing that the demand for more efficient processes runs deeper than just your specific department.
Step 4: Collect findings in a report
Finally, you will want to be sure to collect all of your findings from the previous three steps in a report for easy access and referencing when building an ROI calculator and making the case for systematic improvements.
Recording your observations methodically, whether in a formal evaluation or informal audit, will make it significantly easier to organize and share your findings. Ultimately, this report will come in handy when it’s time to present your research and estimates to leadership teams who will have the final say in regards to adopting new software and processes.
Using the ROI calculator template
Now that you’ve conducted a thorough review of your existing practices, it’s time to take a look at the ROI calculator template and start building your ROI calculator!
To start, download the template spreadsheet here and open it in Microsoft Excel or Google Docs.
Your template will start with blank fields for entering key information, but for the sake of this walkthrough, we’ve provided sample images to demonstrate what your calculator will look like with values added.
Upon opening the template, you will see that it is divided into four tabs: 1-General Information, 2-Labor Estimates, 3-Returns, and 4-Qual Matrix.
General Information
The General Information tab is the first stop for building your ROI calculator. This tab is very straightforward and contains fields for entering key personnel salary information.

Check the listed personnel categories to confirm that they are relevant to your operations. You may change titles as is necessary, but will need to make sure to update the matching titles; they are autofilled in the rest of the workbook. You may also add new personnel roles beyond the six listed in rows 8–14, but you will also need to adjust the corresponding rows, columns, and formulas later in the sheet to include these additions.
Once you have determined that the titles are accurate or have been updated, enter the salary information (or rough salary information, if exact numbers are not available) in column C. Then, update the “Hours in week” number in cell B13 to reflect your team’s standard work hours.
Labor Estimates
With the first tab complete, you’re now ready to move on to the labor estimates tab.
You’ll want to begin by reviewing the processes in column A to ensure that they match the processes regularly undertaken in your research department. Feel free to update the task names or add additional rows, making sure that the existing formulas in columns H–AE are copied into the new rows.
For more information on copying formulas to new rows, columns, and cells, reference the guides here for Excel and here for Sheets.
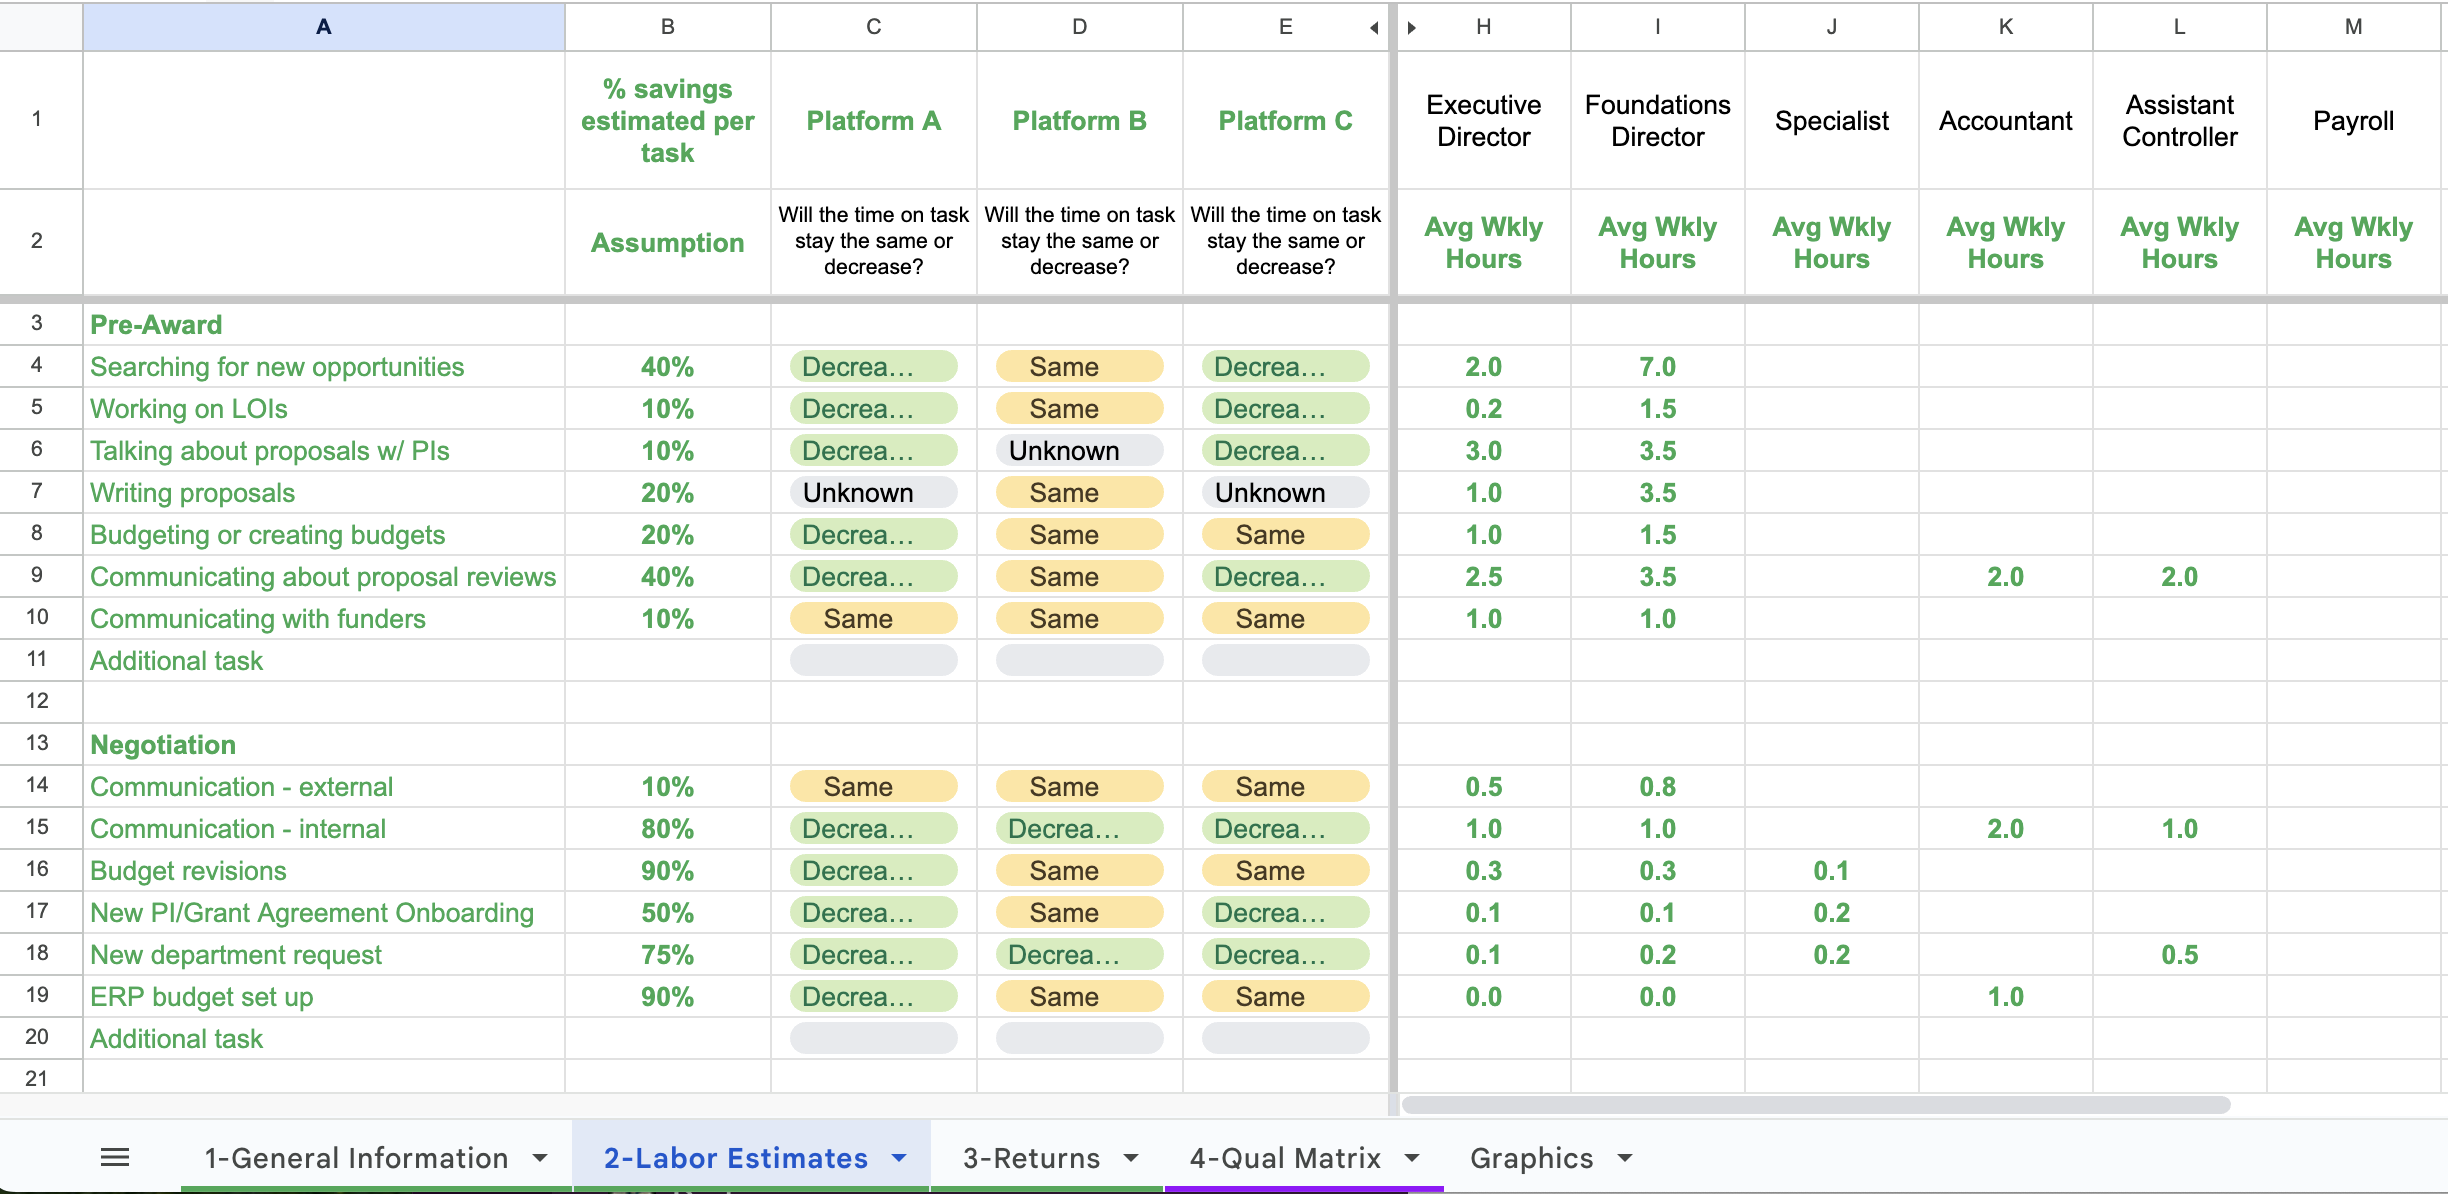
With the tasks reviewed and confirmed, you’ll next need to enter the average weekly hours spent on each task by each role in columns H–M. If you changed any of the role names or added additional roles, make sure that the columns are adjusted to reflect these changes, including extending existing formulas into each new column as is necessary.
Once you begin adding the weekly hour numbers, you will see the values in columns O–W begin to populate! These figures will help assign time and dollar values to different tasks and ease comparisons when entering estimates for changes introduced by new software options.
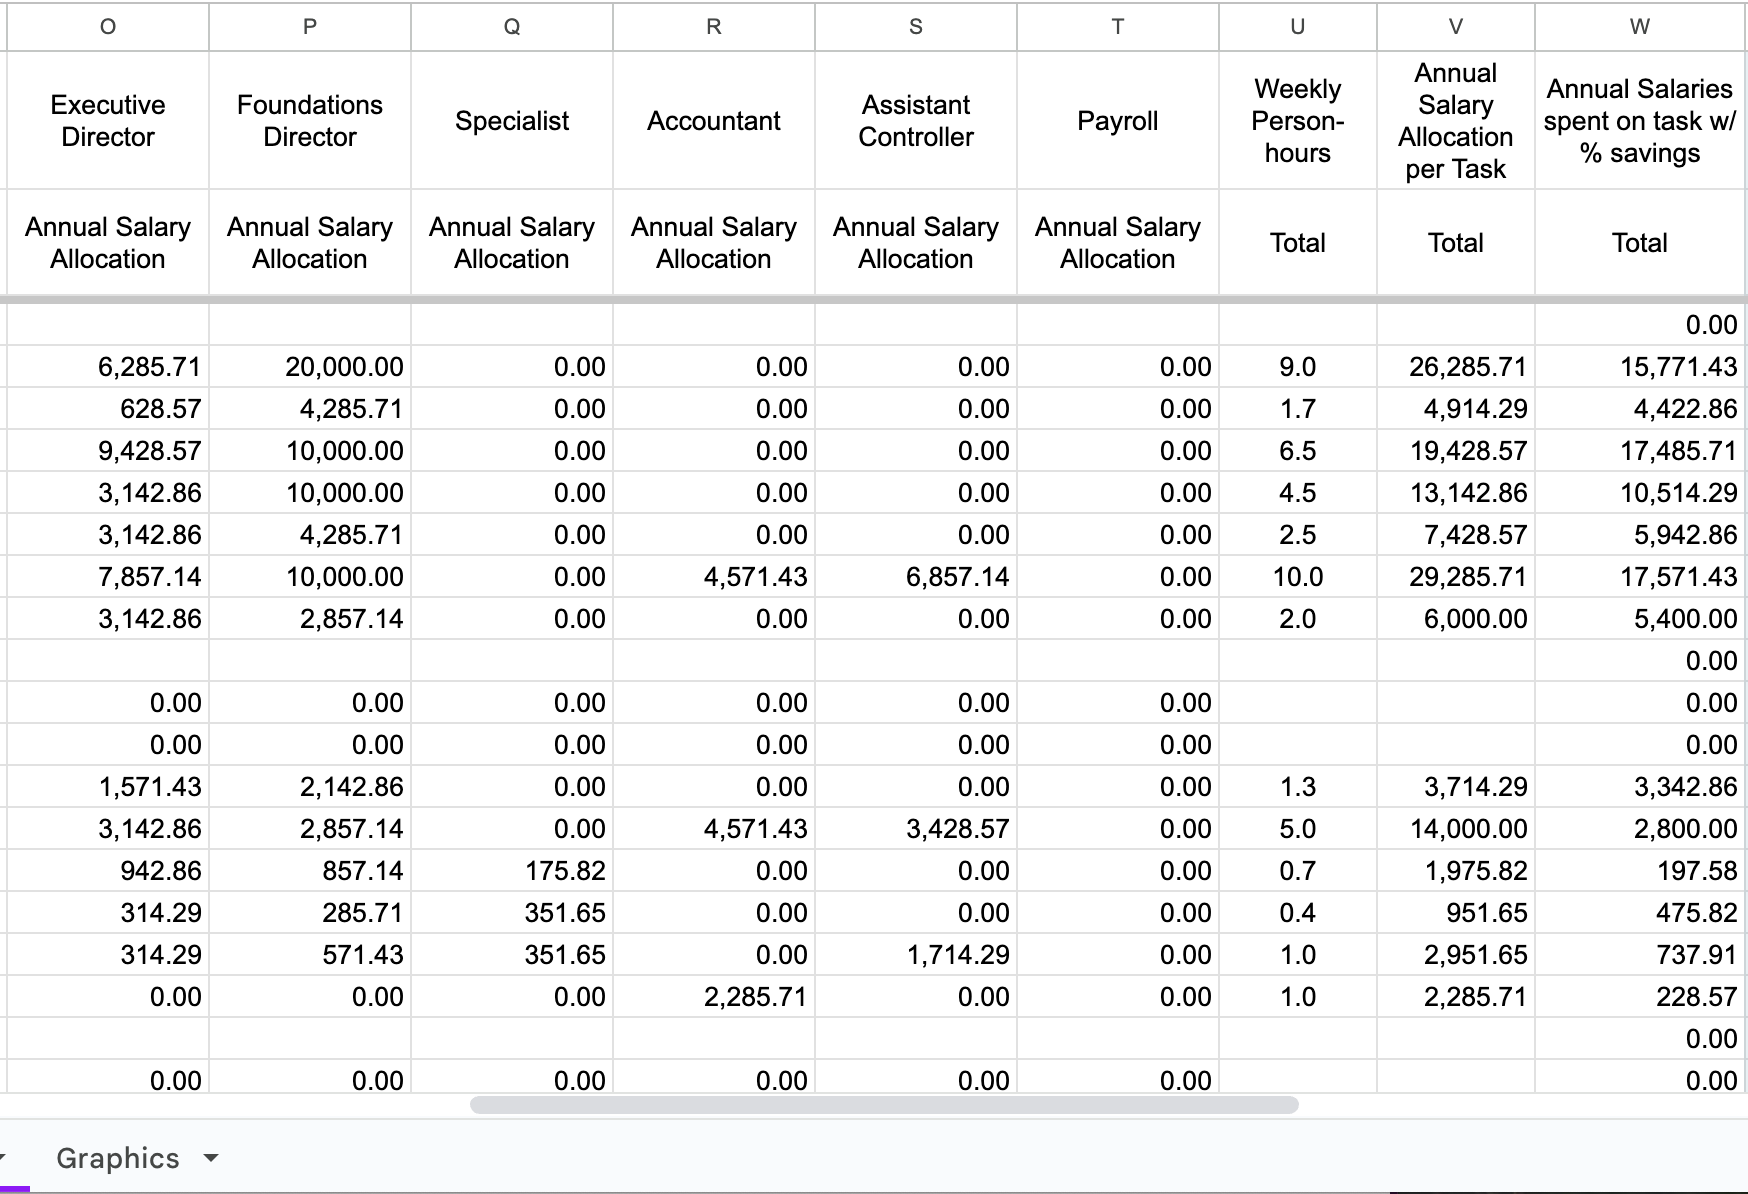
Speaking of new software options, it’s time to start estimating how new software platforms can impact resources spent on each task! For this section, you will need to have started to vet different software platforms to determine their strengths and weaknesses. Currently, the template allows you to compare up to five platforms in columns C–G, but you can add more platform columns as needed, making sure the formulas in these columns are extended to any additions.
You will notice that the estimated percentages of time savings for each task have already been entered in column B. You can keep these figures as they appear, or adjust them based on your own research into the different platform options.
Next, use the drop-downs in columns C–G to indicate whether a specific software platform is expected to decrease the time spent on a task (by the adjustable percentage in column B), if the time per task is expected to stay the same with the new platform, or if you are unsure.
As you enter these estimates, you will notice that the values in columns X–AE have begun to populate. These columns represent the maximum (X–Z) and conservative (AC–AE) annual savings estimates for each task, as calculated by the current time spent on each task, staff and salary required for that work, and how much a new software platform is expected to impact the amount of time required for each task.

With your hourly time spent on task estimates and time savings estimates entered, congratulations! You’ve completed most of the manual entry for your calculator, which should now display additional results on the following two tabs.
Returns
The Returns tab summarizes the estimated ROI on a variety of levels based on your entries in the previous two tabs, including maximum, minimum, and average savings broken down by research stage, as well as the estimated impact on salary and FTE budgets.

This tab also includes a pre-built Estimated Annual Savings chart for easy data visualization, plus space for additional visualizations of your choosing.
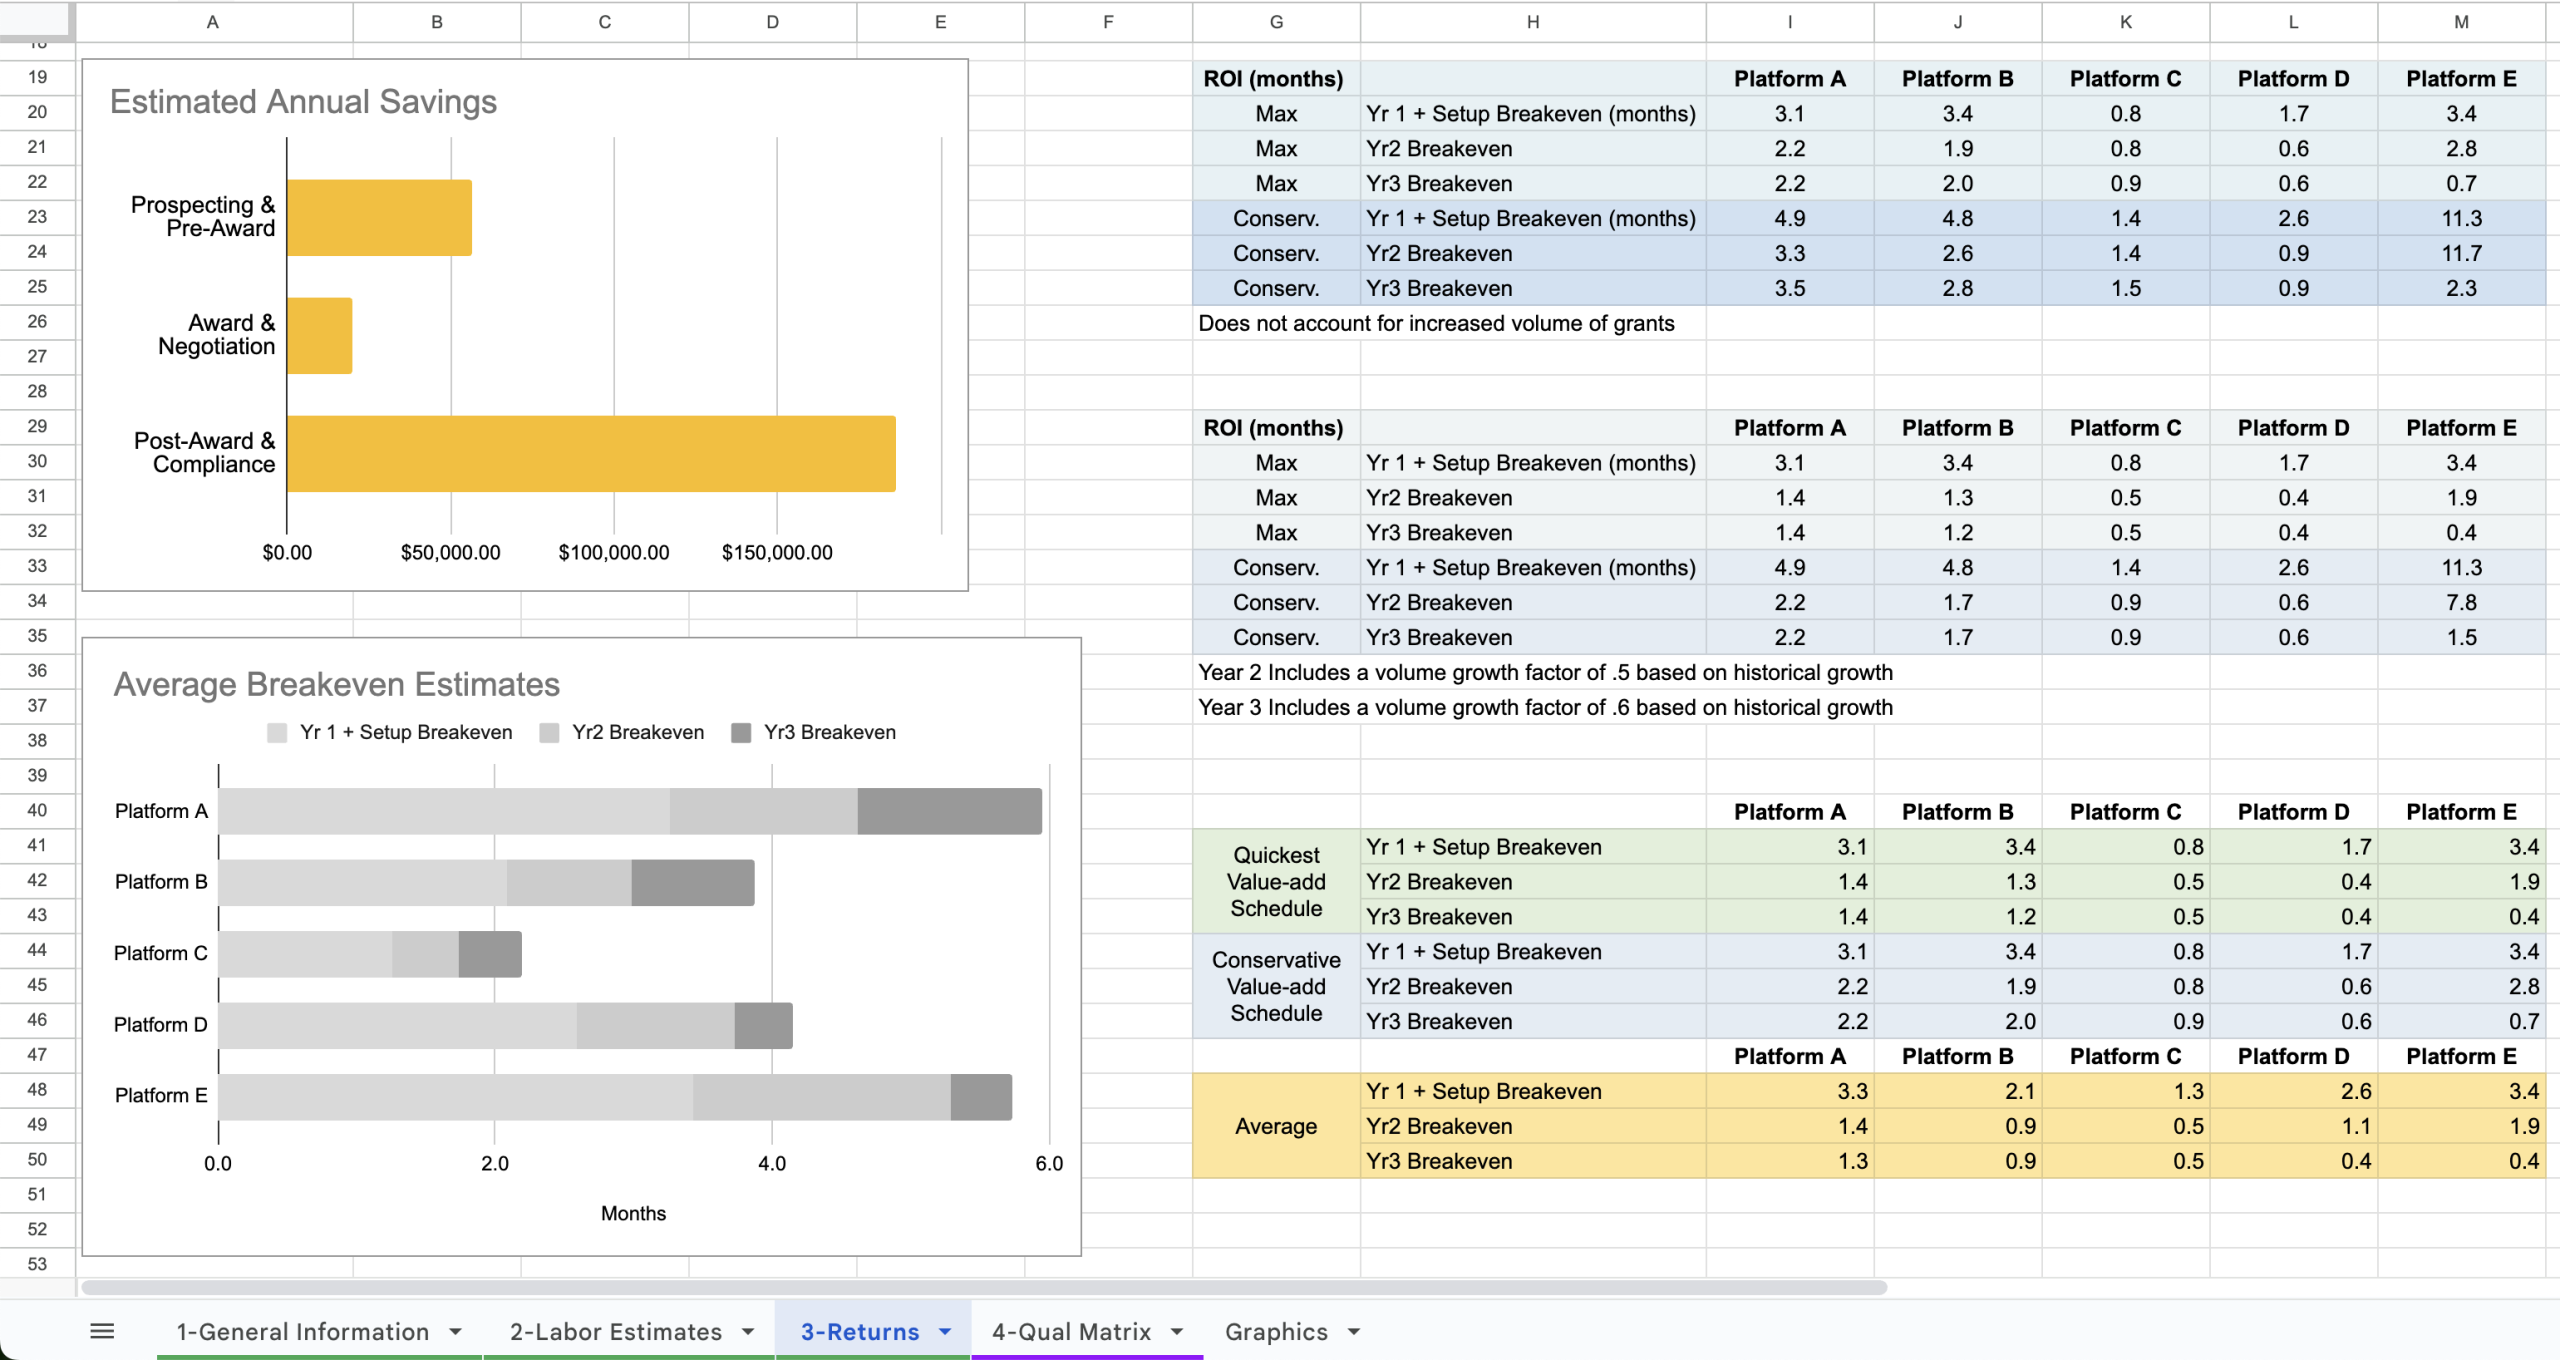
Finally, columns G–M contain ROI estimates for your different vendor options. Note that you will need to enter quotes for annual software costs and implementation completion date estimates to calculate the rest of the cells in this tab. Once this information is entered, you will have a helpful comparison between your platform options and their ROI potential.
Qual Matrix
Not every benefit or drawback of a new research administration software platform can be easily quantified; that’s why the fourth tab, Qual Matrix, provides a helpful breakdown of software functionality and criteria.
Here, you can enter how important each criterion is for your team in column A, then take notes during your vendor meetings to assess and score how well each platform is expected to meet your needs and expectations in columns D–K.
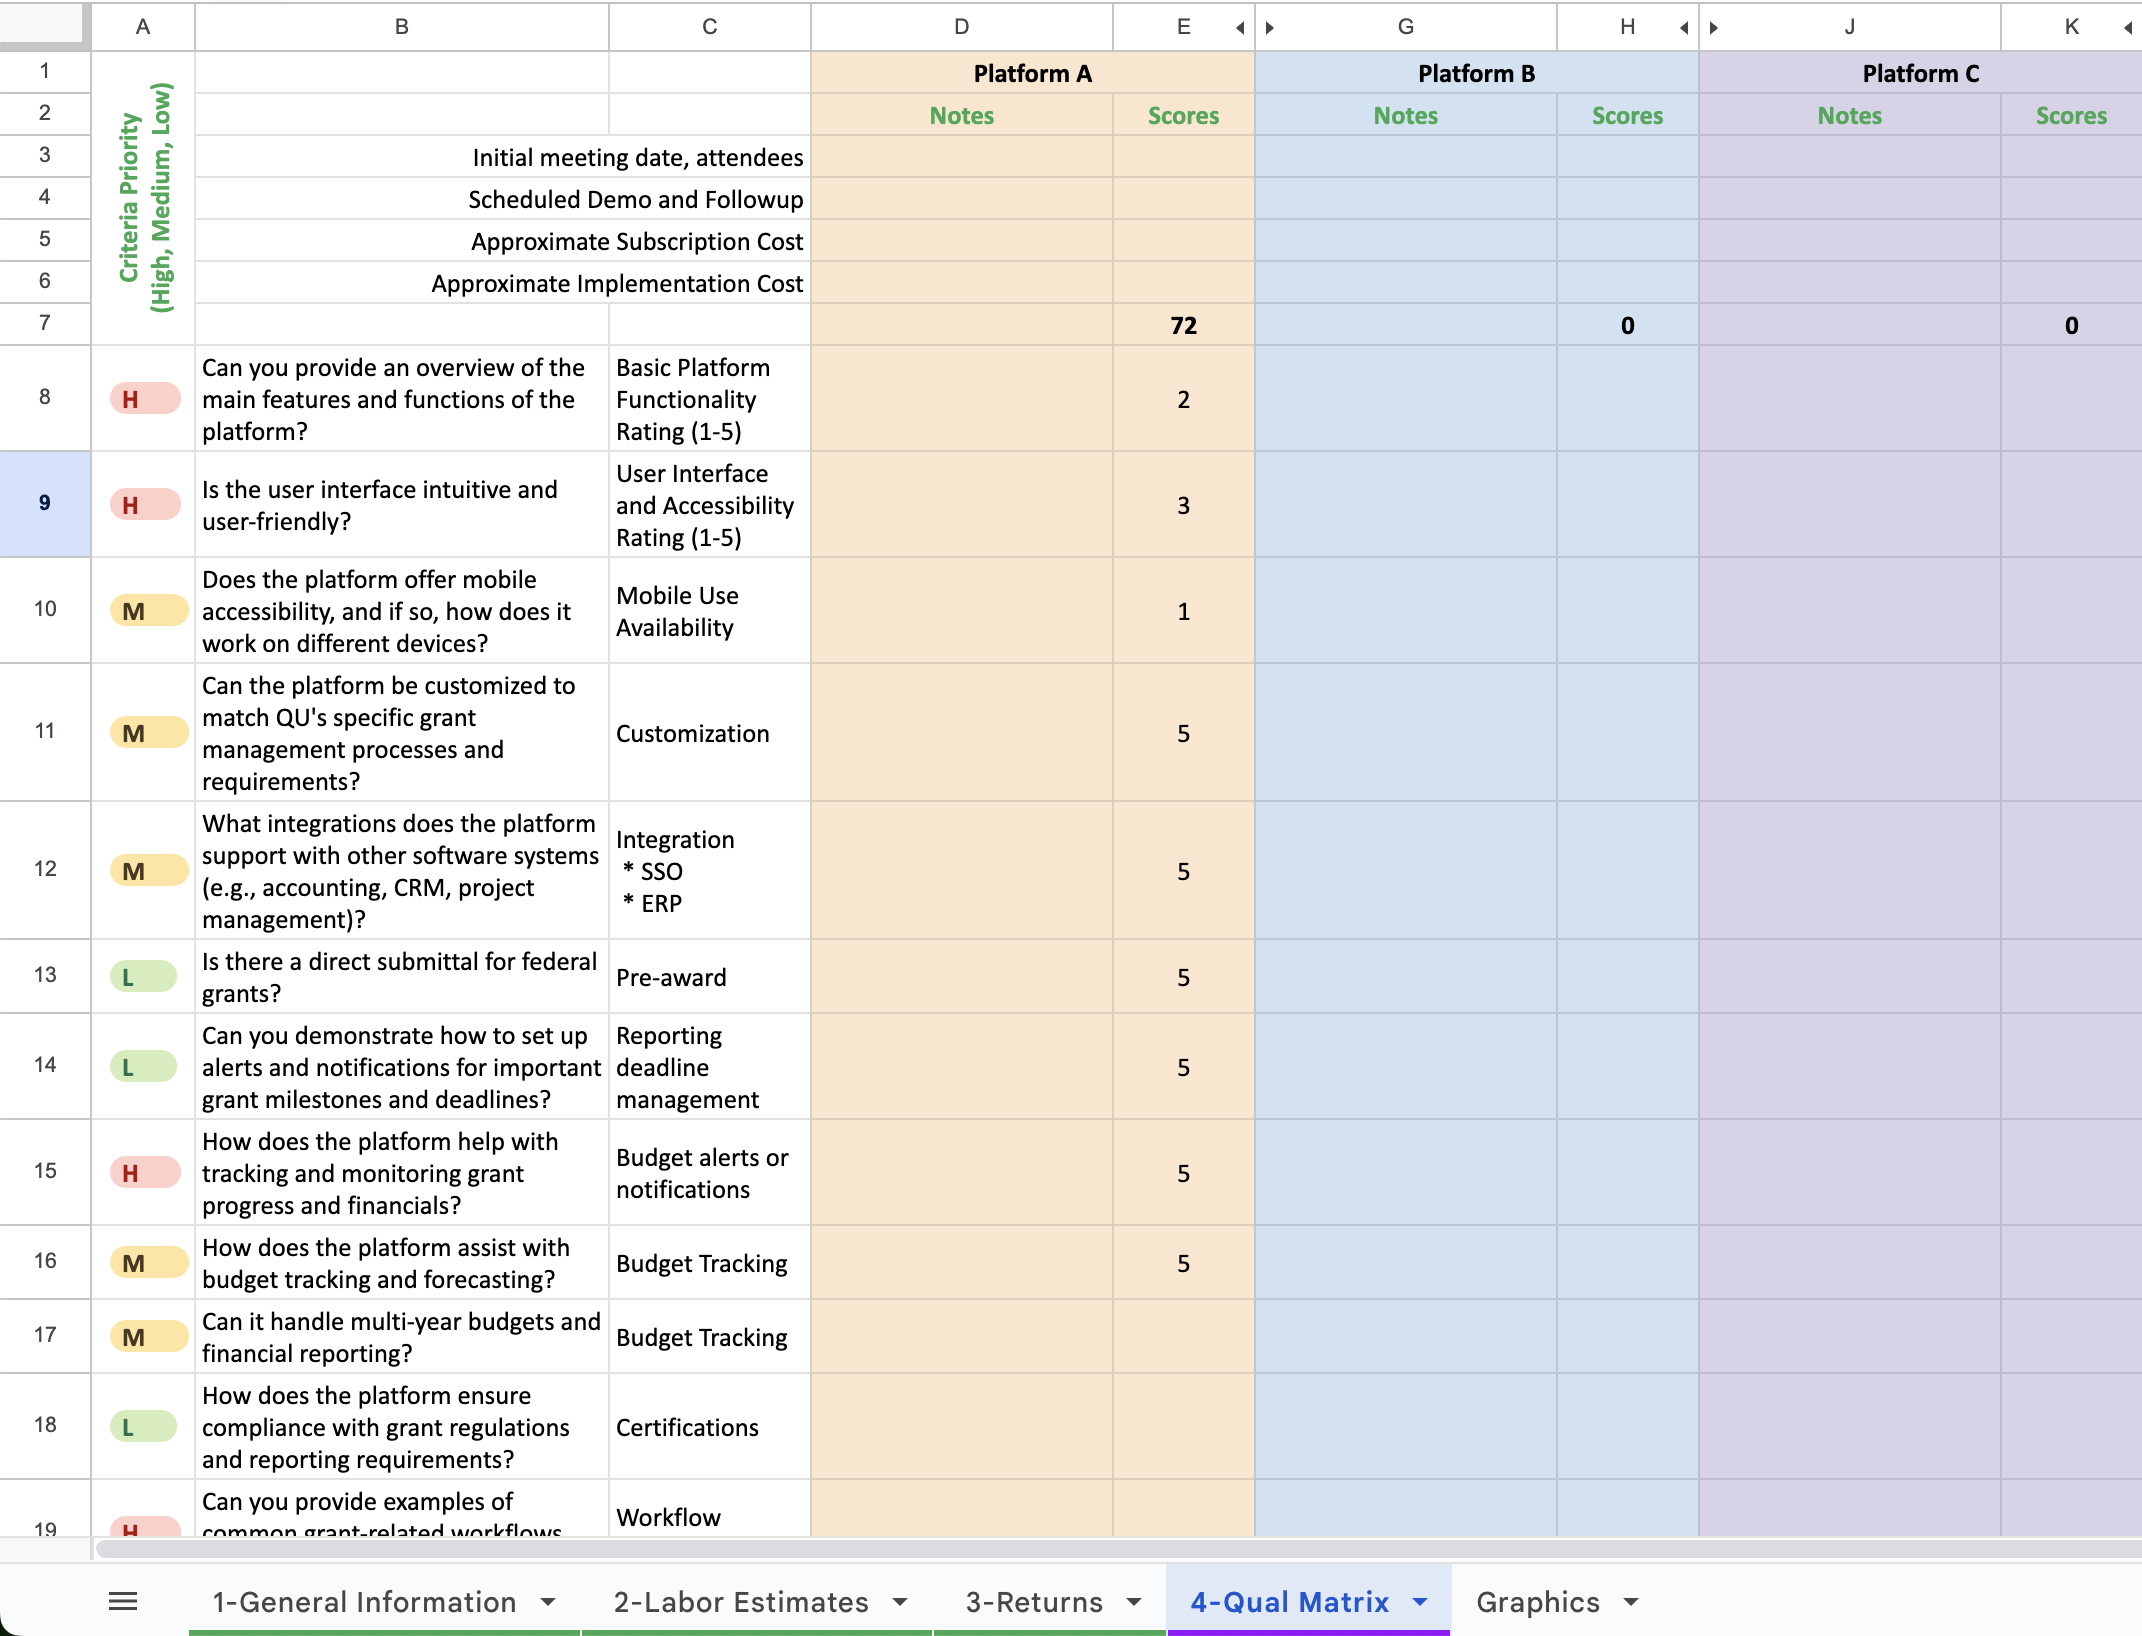
These cells do not utilize formulas, so the criteria in column A can be adjusted as needed without concern for impacting the rest of the tabs in the sheet. Instead, this tab is intended to give you a more well-rounded view of each potential platform and can help inform the expected savings per task entered in columns B–E of the Labor Estimate tab.
Final Thoughts
There are undoubtedly many factors to consider when looking at new research administration software, and while this ROI Calculator may not contain them all, it should help your search and assessments significantly by organizing and calculating key ROI opportunities.
From everyone here at Cayuse, we would like to express our sincere thanks to Carrie for building this spreadsheet, and hope that you will find this calculator helpful in your own search for potential new research management software!